

In the world of IoT, creating a large amount of data through sensors is extremely common and is one of the challenges faced by IoT today - both from a transmission perspective and from a data management perspective. One example of this is the sensors deployed on airplanes in the commercial aviation industry.
Real-world examples of IoT data analytics
Comparison of Structured and Unstructured Data
Real-world examples of IoT data analytics
Modern jet engines on airplanes are equipped with thousands of sensors to ensure stable operation of the aircraft engine, producing up to 10GB of data per second. As shown in Figure 1.1, modern commercial aircraft are equipped with about 5,000 sensors in their jet engines alone. Therefore, if a twin-engine commercial aircraft has an average operating time of 8 hours, the data generated per day will exceed 500TB, and this is just from the engine! Today's aircraft have tens of thousands of other sensors connected to various parts of the aircraft systems. In fact, modern large jet aircraft have 10,000 sensors on their wings alone.

Figure 1.1 Jet engine of a commercial aircraft
The difficulty of obtaining petabytes (PB) of data per day for each aircraft is not significant - this is just for one aircraft. Currently, there are over 100,000 commercial flights worldwide. The IoT data generated by these commercial aviation businesses is astonishing.
This example is just one of many examples of the increasingly serious big data problems in IoT. Analyzing this data in the most effective way possible is essential. Data analysis must be able to timely find useful and actionable insights and knowledge from the data, regardless of how the data is presented, otherwise it cannot fully reflect the advantages of IoT.
Before analyzing data, it is necessary to define key concepts related to data. First, not all data is the same; they can be classified and analyzed from different perspectives and methods. Depending on the classification of data, various data analysis tools and processing methods can be applied. From the perspective of IoT, these two overviews are important bases for structured and unstructured data, and for evaluating whether data is dynamic or prohibited.
Comparison of Structured and Unstructured Data
The structure of data is an important classification of data, because from the perspective of analyzing data, they usually need to use different data analysis toolsets. Figure 1.2 provides a comparison of structured and unstructured data differences.
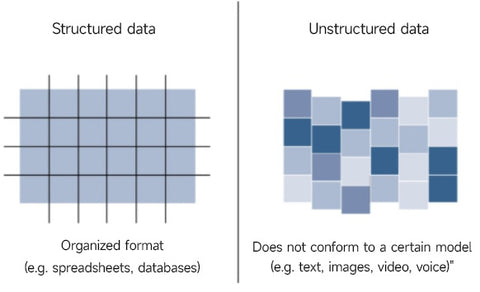
Figure 1.2 Comparison of structured and unstructured data
Structured data follows a model/pattern that defines the expression and organization of the structure of the data, which means it is very suitable for traditional relational data management systems (RDBMS).
Structured data can be found in most computer systems, including everything from invoice statistics after bank transactions to log files and router configurations on computers. IoT sensor data typically uses structured values such as temperature, humidity, and air pressure, which are sent in known formats. Structured data is easy to format, store, query, and process; because of these features, it has always been the main data type for industry decision-making.
Unstructured data lacks interpretation and decoding through traditional programming. This data type includes text, voice, graphics, and video. Generally, any data that does not fully comply with the predefined data model is classified as unstructured data.
According to statistics, about 80% of business data is currently unstructured data. Because of this, analysis methods for unstructured data are relatively complex, such as cognitive computing, machine learning, natural language processing (NLP), and artificial intelligence. These technologies can extract key information from a variety of unstructured data.
Currently, structured data is easier to manage and process than unstructured data. It is important to be familiar with these two data classification structures so that you can judge which data classification is easier to use and give appropriate data analysis solutions.
Like most network applications, data in IoT is either "in transit" (dynamic data) or has already been saved or stored (static data). Dynamic data includes traditional exchanges between clients and servers, such as user data transmitted through WEB browsers over the network, email transmissions, etc. Data saved to physical hardware such as hard disks, USB storage devices, etc. belongs to static data.
From the perspective of IoT, data from smart devices is usually considered motion data because it is ultimately delivered to the final destination via the network. Its collected data is processed by fog computing after edge collection and then uploaded, and finally reaches the data storage center.
After the data reaches the data center, the data center processes the collected data again, and the data in the processing is still in motion. Currently, the analysis and processing tools for dynamic data are still in the initial stage.
Static data in the IoT network can usually be found in the overall IoT data or proxy network. From the perspective of data analysis, there are many tools that can be used, especially for structured data processing tools, which not only provide data processing, but also provide data storage services.
Data from smart IoT devices usually requires processed and filtered data to realize its commercial and analytical value. Data analysis is usually classified and decomposed according to its results, as shown in Figure 1.3, with four types of data analysis.
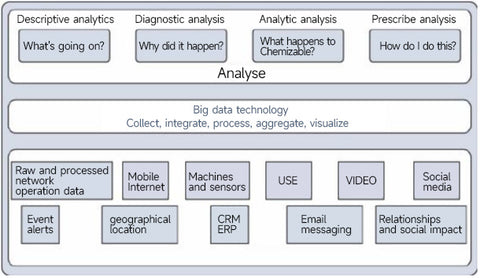
Figure 1.3 Four types of data analysis
Descriptive analysis: This type of data analysis describes what is happening through a descriptive method. For example, a tire pressure gauge reports a pressure value every second. Through these data, the device operator can monitor the status of the device at any time to ensure the safe and stable operation of the device.
Diagnostic analysis: This type of analysis understands why the device produces data by analyzing the way the device operates, thus diagnosing device problems.
Predictive analysis: Predictive analysis is to predict the occurrence of problems before they occur in order to achieve stable device operation. For example, if the temperature of the water tank in a running car gradually rises, it indicates that the car may need to replace the oil or the water tank needs maintenance.
Prescriptive analysis: Prescriptive analysis goes beyond predictive analysis and provides solutions to upcoming problems. For example, data analysis processing methods for water tank climbing problems provide various alternative solutions.
Predictive analysis and prescriptive analysis are resource-intensive data analysis methods, and their value far exceeds the data itself. As shown in Figure 1.4, descriptive analysis is the simplest and prescriptive analysis is the most difficult among the four types of data analysis, with difficulty increasing in gradient, and prescriptive analysis provides the most value but is also the most complex. Currently, most IoT data analysis relies on descriptive analysis and diagnostic analysis, but the demand for predictive analysis and prescriptive analysis is urgent for current enterprises.


